Lights on·off

Contact

ProfitGraph: Empowering Data-Driven Insights

Contact

ProfitGraph: Empowering Data-Driven Insights

The Sales SaaS Dashboard CRM enhances sales team efficiency by esolving data fragmentation

and integration challenges with a user-friendly interface.

Enhancing Sales Efficiency

Enhancing Sales Efficiency

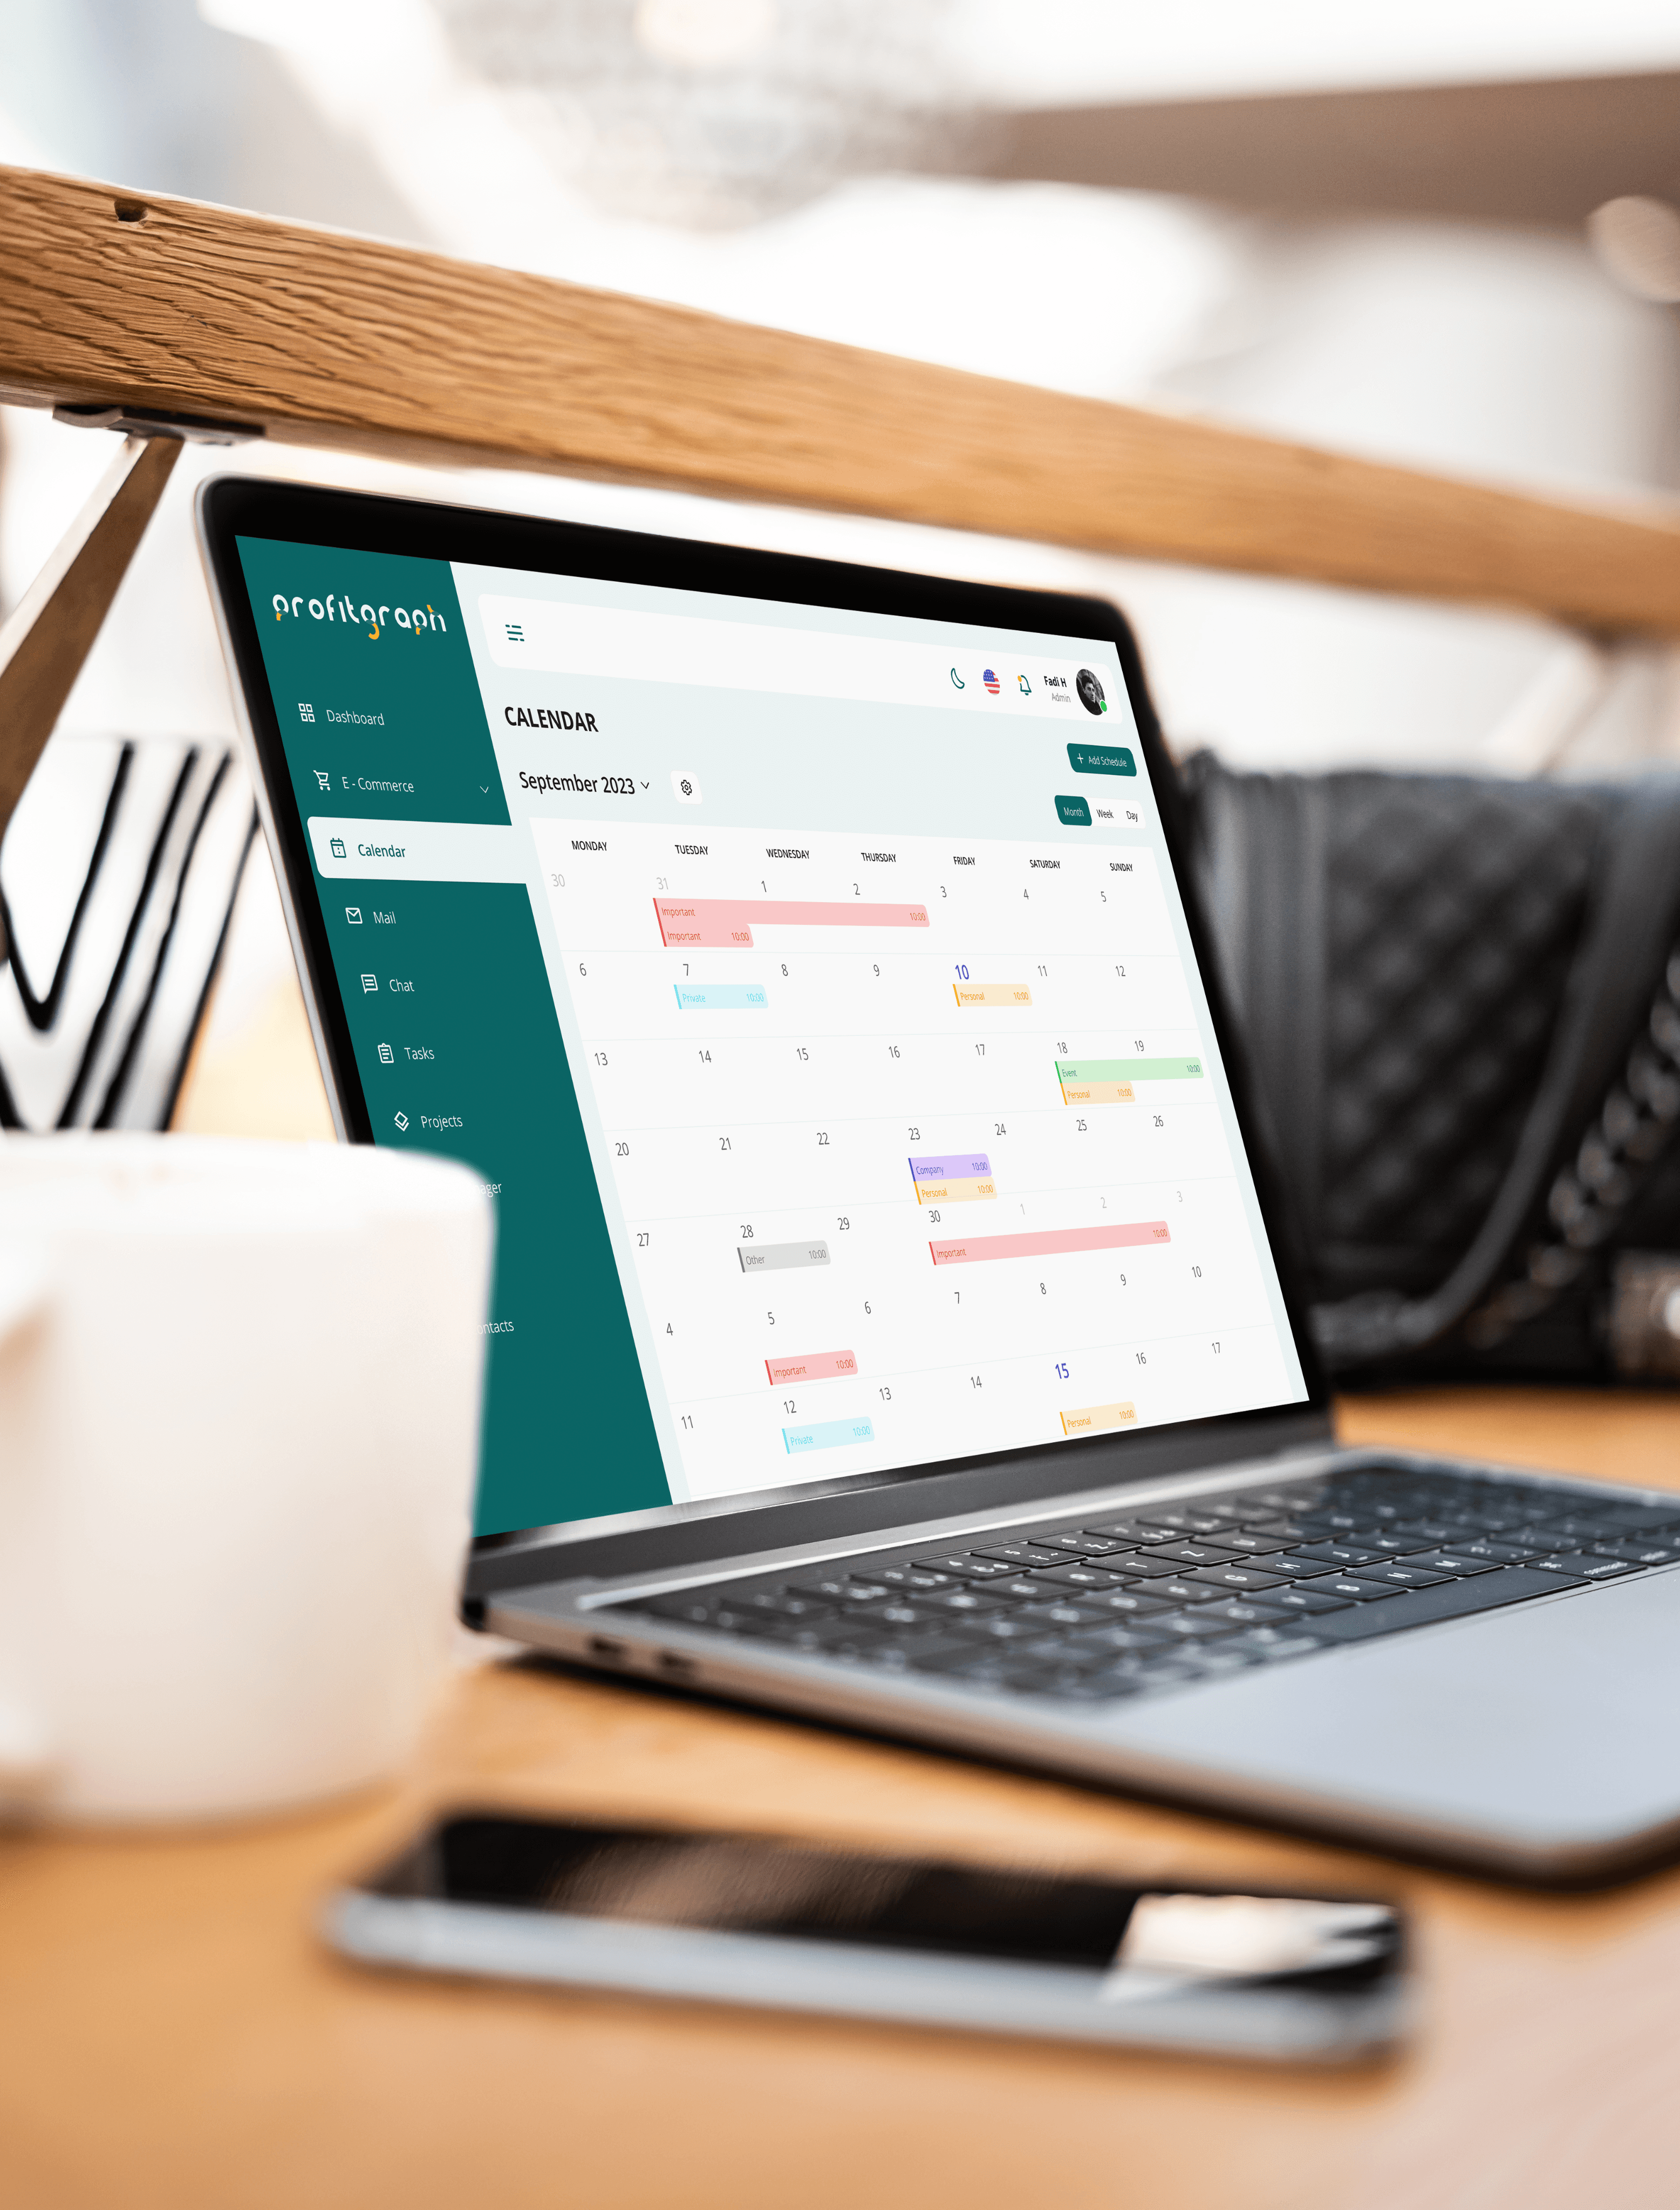
A SaaS CRM Dashboard Tailored for Businesses

B2B

Product Design

Case Study

UX/UI

Prototype

Credits

Closing Thoughts

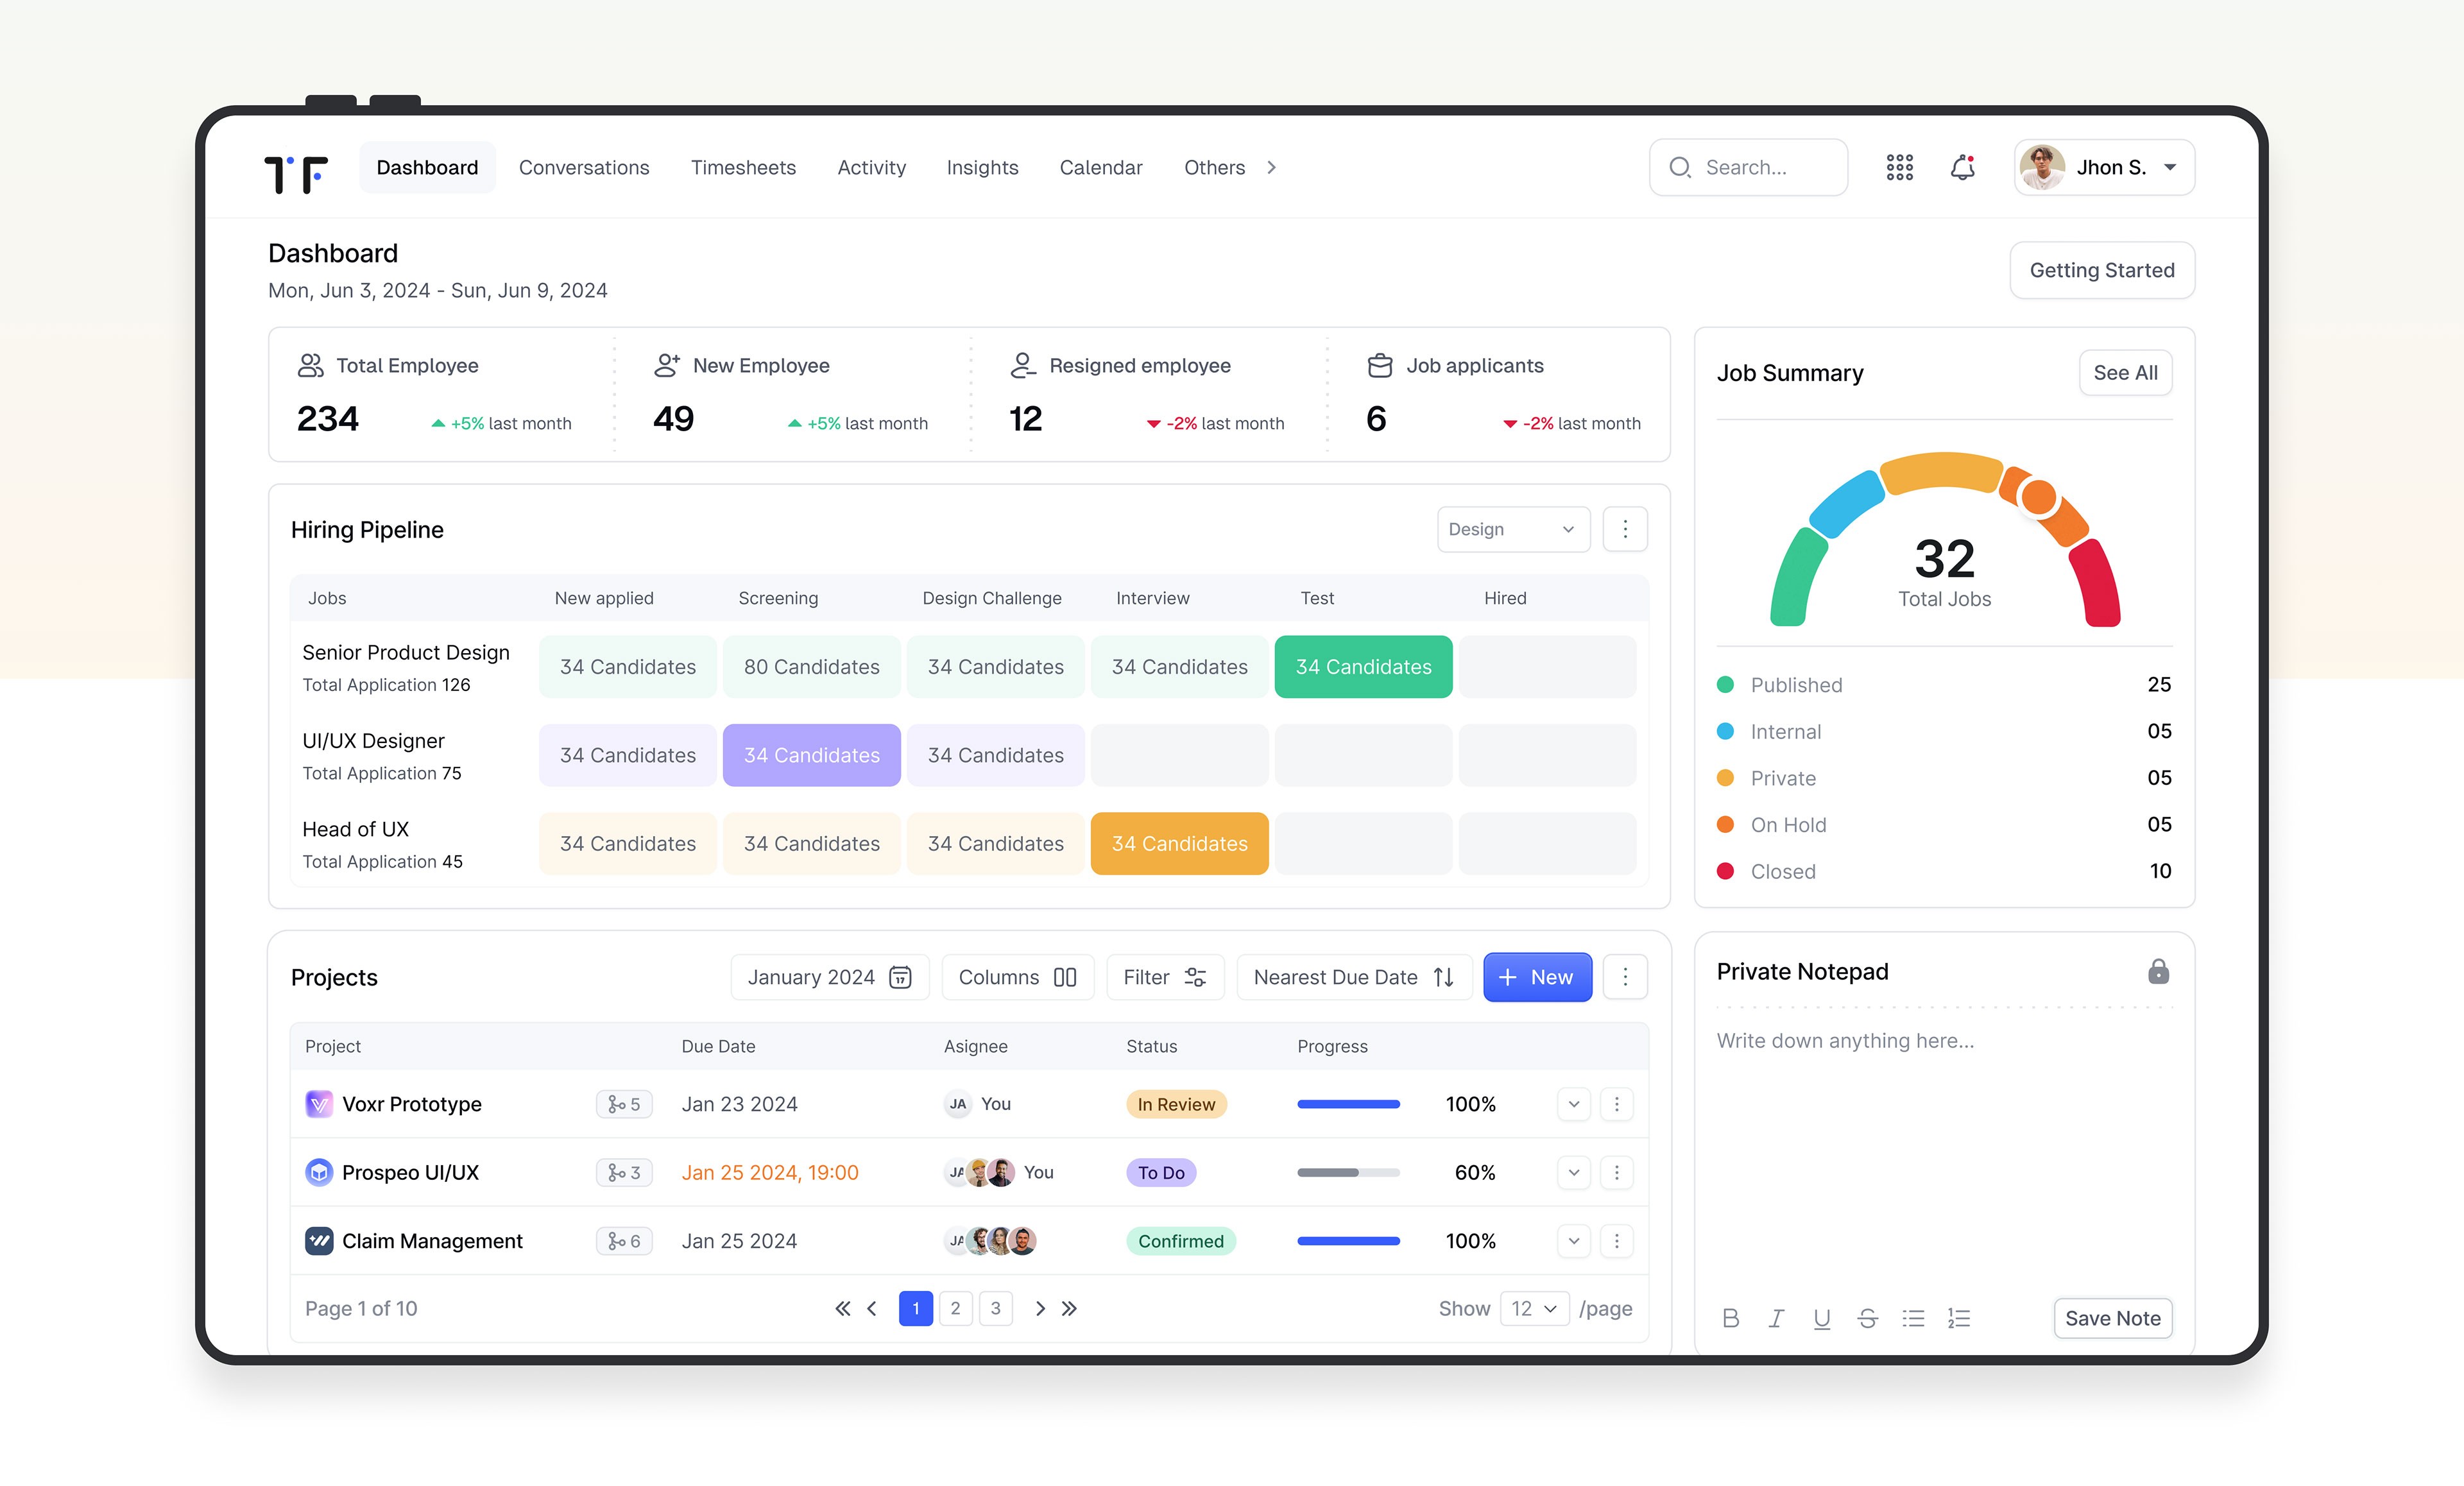
ProfitGraph Dashboard is a cutting-edge SaaS Admin Dashboard CRM tailored for sales teams. This solution addresses the critical pain points faced by sales professionals, such as fragmented data, manual data entry, and integration challenges. Designed to streamline processes and provide real-time insights, ProfitGraph empowers teams to exceed their sales targets with ease.

Services

User Research

UX/UI Design

Prototyping

Data Management

Accessibility Design

Tools

Figma and FigJam for UI/UX design

Adobe Suite for graphic design

React.js and Node.js for front-end and back-end development

MongoDB for database solutions

AWS for hosting and cloud services

team

Project Lead

Artur Doe

Quality Assurance

Nina jr

Client Relations

Raj Patel

UX/UI Designer

Fadi Hakim

Mike Schmidt

Developers

Fatima Connor

Alan Turing

Client Challenges

Before the implementation of our dashboard, sales teams faced several significant challenges:


Data Fragmentation: Information was scattered across various platforms, making it difficult to have a unified view of sales metrics.

Manual Data Entry: Time-consuming manual entry led to inefficiencies and increased the likelihood of errors.

Lack of Integration: Existing systems were not well-integrated, hindering the flow of data and insights across departments.

Understand

observe

Ideate

Design

Prototype

Test review

High-Fi

Problem Detection

Conceptualise

Design interaction

Feb 3, 2024

User data management insights

📊 User data management desires
• Users want streamlined data entry processes and efficient data organization.
• They seek easy access to key metrics and enhanced integration with other systems.

🔄 Automation and integration needs
• Automation in data entry and improved data flow between tools are desired.
• Seamless integration with other systems is crucial for efficient workflows.

🧩 Pain points of John Matthews and Jane Doe
• John and Jane face challenges with data silos, manual data entry, and lack of integration in their sales dashboards.
• John needs streamlined data management and automation in data entry, while Jane requires enhanced integration.

📈 Key requirements for data visibility and collaboration
• Sales managers need real-time access to key pipeline metrics and customizable dashboards.
• Representatives seek seamless integration with other tools for efficient workflows.

📊 Dashboard overview and data visualization
• Utilize interactive charts and graphs for visualizing sales performance.
• Access key metrics at a glance for quick decision-making and dive deep into specific data points for detailed analysis.

Heads up: AI outputs can be misleading, or even flat-out wrong.

Automation in Data Entry

Streamlined Data Management

Enhanced Integration

Introducing Jane Doe

Pain Points

Similar to John, Jane faces challenges with data silos, manual data entry, and integration issues in her sales dashboard.

Meet John Matthews

Pain Points

Data silos, manual data entry, and lack of integration hinder John's sales dashboard management.

The Solution

ProfitGraph Dashboard was designed to tackle these challenges by consolidating data, automating routine tasks, and integrating seamlessly with existing sales tools. This enables a holistic view of sales activities and boosts overall productivity.

ProfitGraph Dashboard was designed to tackle these challenges by consolidating data, automating routine tasks, and integrating seamlessly with existing sales tools. This enables a holistic view of sales activities and boosts overall productivity.

Research & Insights

Age

48

Marital Status

Married with 2 children

Post Graduate

Education

BIO

Habits

Motivation

Want

Frustration

John Matthews

John is a sales manager with 23 years of experience.
He is highly motivated and results-oriented, and he is always looking for ways to improve his sales performance.
He is also a very organized and detail-oriented person.
John uses his SaaS Dashboard every day to track his sales pipeline, manage his leads, and track his sales performance.
He also uses the CRM to create reports for his team and his managers.
John is always looking for new ways to use his CRM to improve his sales results.
John wants a Dashboard that is easy to use, powerful, and integrates with his other sales tools. He also wants a CRM that provides him with real-time insights into his sales data.
John is frustrated with his current SaaS Admin Dashboard CRM because it is difficult to use, not powerful enough, and does not integrate with his other sales tools.
Work performance
Focus
Family
The sales manager facilitates the process of analysing your pipeline of prospects and identifies those with the highest probability of success.

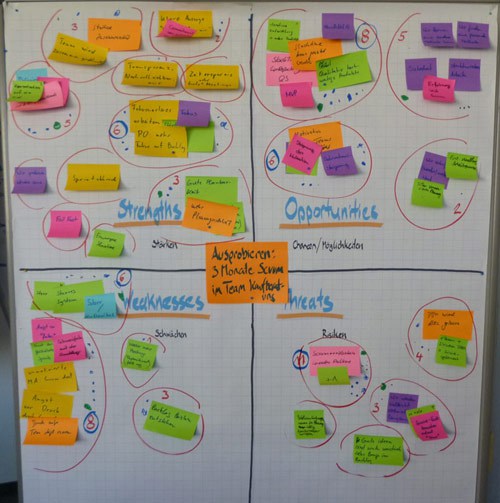
User-Centered Design Approach

Include a visual of sticky notes representing brainstorming sessions, user feedback, and initial ideas. This could be a digital mockup or a real image showing the iterative design process.

Include a visual of sticky notes representing brainstorming sessions, user feedback, and initial ideas. This could be a digital mockup or a real image showing the iterative design process.

User Research & Insights

User Experience research

hypothesis

user research

Insights

potental pain points

diving deeper

user interviews

verifiction of hypothesis

SaaS sales teams face challenges managing admin dashboards due to data silos, manual data entry, and lack of integration.


Data is often siloed across different systems, making it difficult to get a consolidated view of sales performance.

If we can develop a SaaS Admin Dashboard CRM that addresses these pain points, we can help SaaS companies improve their sales performance by:


Streamlining data management, Automating data entry, Enhancing data integration

Sales teams want streamlined data entry, automation, and enhanced integration for a consolidated view of sales data, including CRM, marketing, and accounting systems, to optimize efficiency and reduce errors.

Am conducted user interviews with SaaS sales teams to understand their pain points and needs. We found that;

Saas Admin Dashboard CRM is needed and customers want a user-friendly, integrated, and insights-driven platform.


Defining user stories & requirements

user story

As a sales manager, I want to:

As a sales team leader, I want to:

As a sales manager, I want to:

As a sales representative,

I want to:

See a clear overview of my sales pipeline

Generate reports and presentations

Unify customer data across all systems

See a personal performance dashboard that tracks individual metrics

Receive personalized feedback and coaching to help improve my performance

Receive real-time updates on pipeline data

Share insights on social media

feature requirements

Display key pipeline metrics

Customizable dashboard for individual sales managers

Share insights from my dashboard with my team

Integrate my dashboard with other sales and marketing tools

Track my personal performance and set goals

Export data to other formats

Automate data synchronization to keep data up-to-date

Set goals and track progress towards those goals

rationale (focus on MVP)

Essential for managing teams and making informed decisions. “Need

Helps teams collaborate and achieve goals. “Need

Provides a more comprehensive view of the customer journey and improves sales effectiveness “Want

Helps track performance, set goals, and improve. “Want

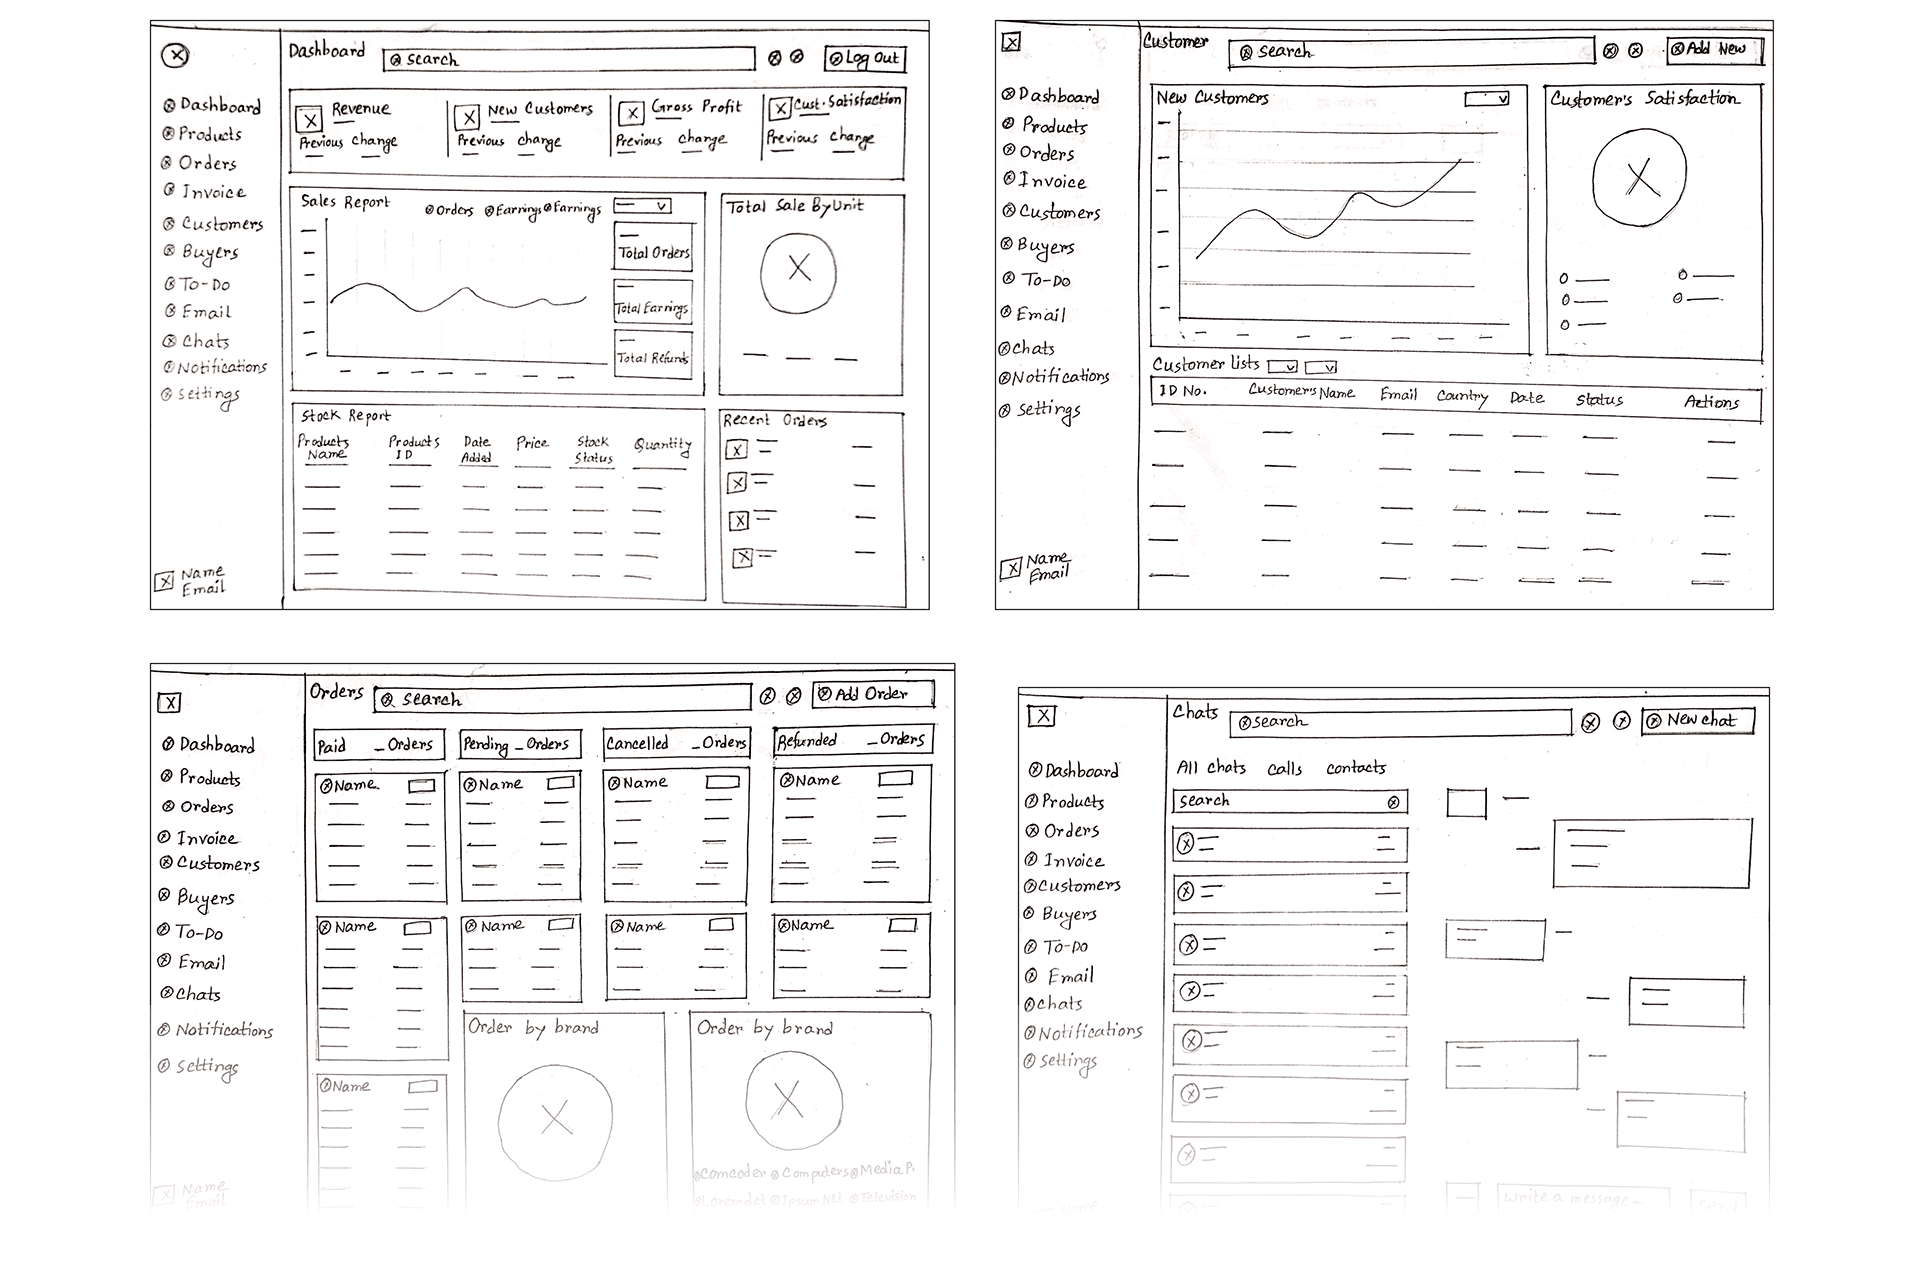
low-fidelity wireframe. "low-fi "
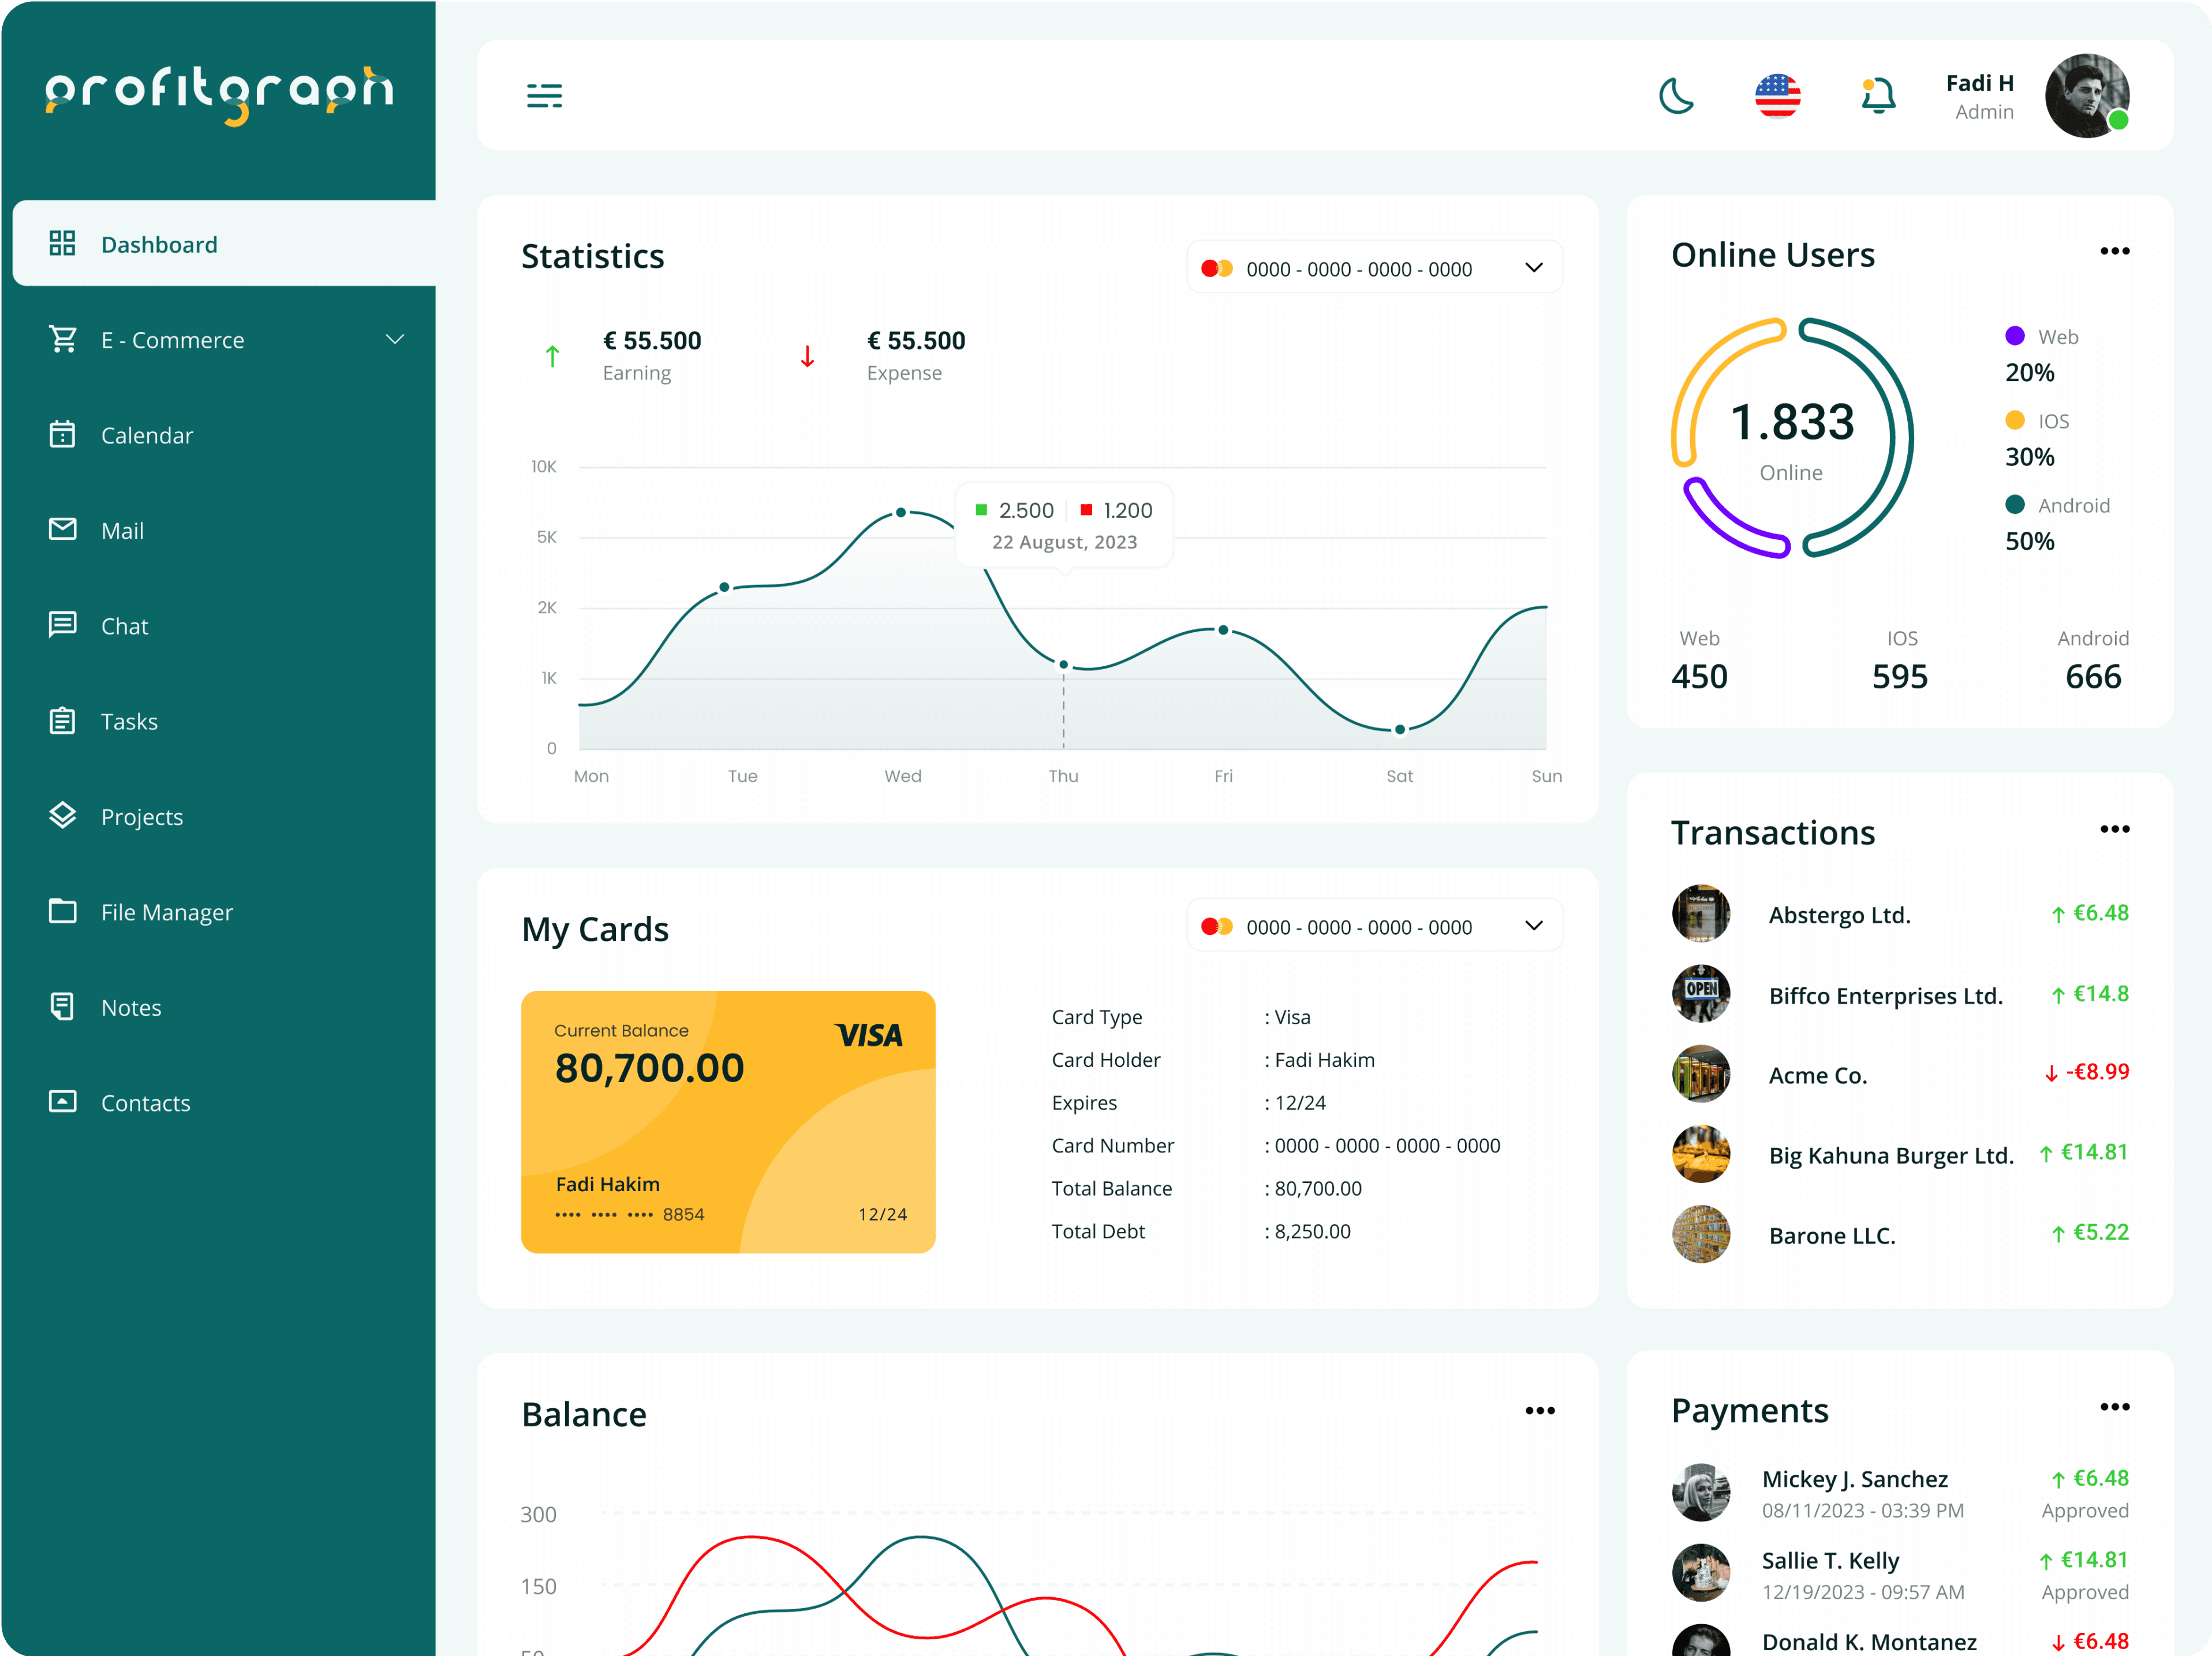
Final Hi-Fi

Ein Produkt von

Erhalte eine Benachrichtigung, wenn ich neue Blogbeiträge veröffentliche

1,1k+ andere Abonnenten

Nehmen Sie Kontakt auf

Senden Sie eine E-Mail oder DM und ich werde mich so schnell wie möglich bei Ihnen melden.

Alle Rechte vorbehalten © 2024 Fadi Hakim

Ein Produkt von

Erhalte eine Benachrichtigung, wenn ich neue Blogbeiträge veröffentliche

1,1k+ andere Abonnenten

Nehmen Sie Kontakt auf

Senden Sie eine E-Mail oder DM und ich werde mich so schnell wie möglich bei Ihnen melden.

Alle Rechte vorbehalten © 2024 Fadi Hakim

Ein Produkt von

Erhalte eine Benachrichtigung, wenn ich neue Blogbeiträge veröffentliche

1,1k+ andere Abonnenten

Nehmen Sie Kontakt auf

Senden Sie eine E-Mail oder DM und ich werde mich so schnell wie möglich bei Ihnen melden.

Alle Rechte vorbehalten © 2024 Fadi Hakim